Over the past couple weeks, one of our volunteers, Lindsay, has been looking into the accounting ledgers of the Newman Brothers’ business. She has written her findings for our visitors to get a sneak peek into parts of the business that have previously not been available to the public. We hope you enjoy!
SALES:
The sales figures are extremely important to the business as they are an indication of the size of the business and its level of activity. Also, if the business is running successfully, the higher the sales, the higher the profits that should be made. The figures used for the graph below are the net sales figures (the value of the sales less any returned goods, otherwise known as turnover. Please note that from 1954 the net sales figure also deducted any discounts that had been received). We have most of these figures from 1916 to 1975, but 1960 – 1962 have not yet been found hence the gap in the graph.
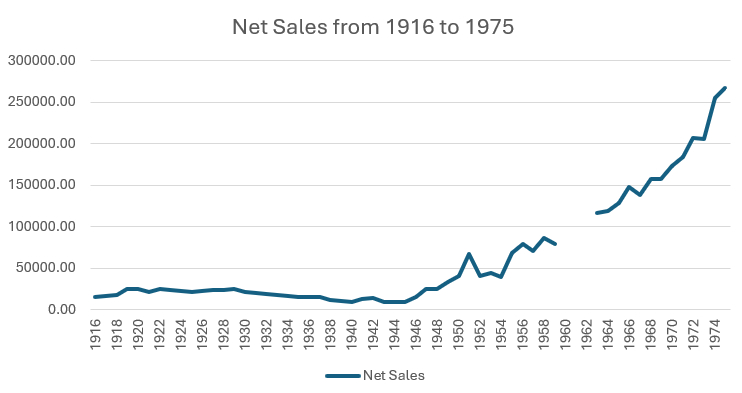
As you can see the sales were steady until the 1950’s but, from then on, the sales figures generally increased until 1975 when the records end. At this point the net sales were over five times higher than they had been previously so the increase was significant. There are many factors that could have affected the sales figures including some or all the following:
- Inflation
- The general state of the economy.
- The Cremation Acts.
- The two World Wars.
- Changing tastes regarding funerals.
- Opening the Shroud room at Newman Brothers.
- Export sales.
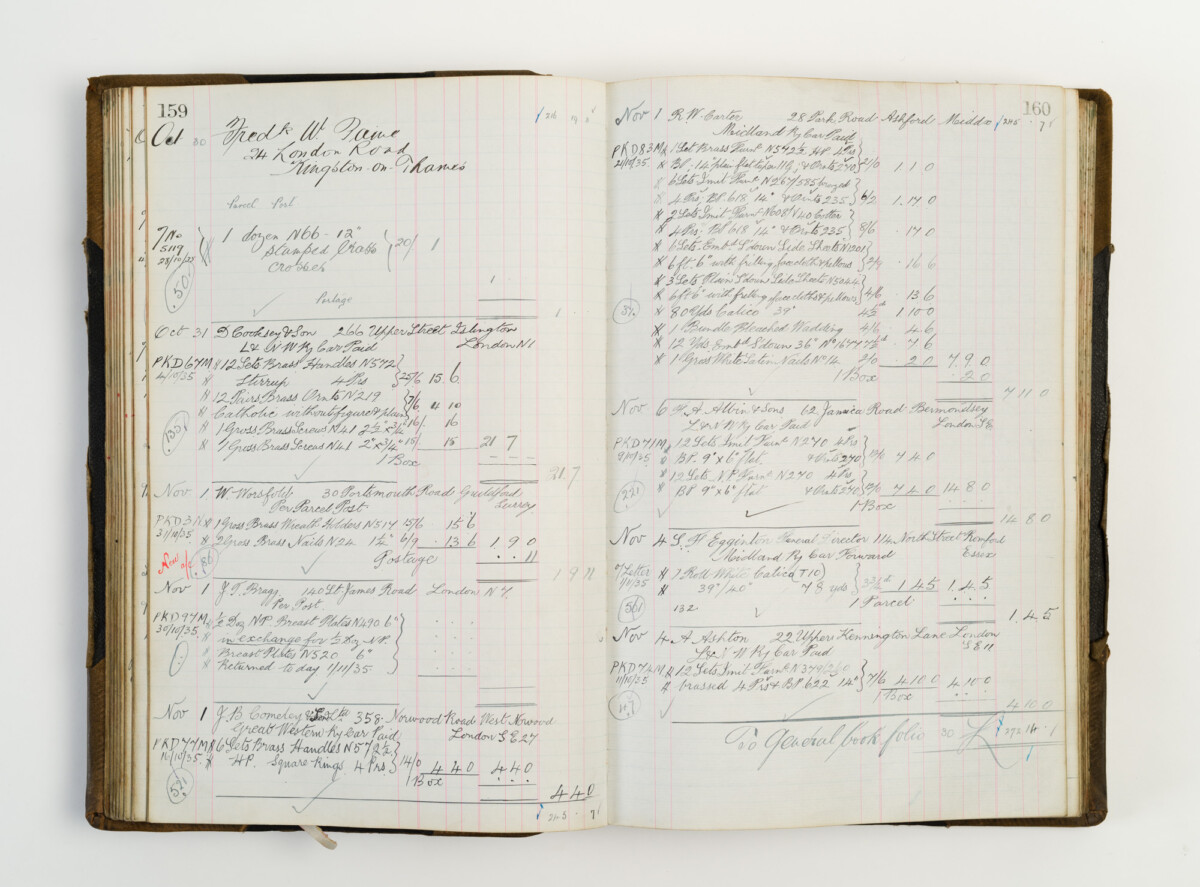
There are many ledgers belonging to Newman Brothers that show much more detail about the sales made, including those to Ireland and, as they described them, “Foreign” sales. Further analysis of these ledgers would be a huge job but would undoubtedly shed some light on why the sales figures varied as they did.
It is strange to see from the graph that, from the early 1950’s up until 1975, sales rapidly increased but realising that the net profits did not follow this trend. The net profit did increase up until 1966 but after that there was then a downward trend in profits. One way to measure this is to look at how much net profit was made for every £100 of sales. In 1966 the equivalent of £7.78 was made for every £100 of sales but, by 1975, this had reduced to just £1.97. In the best year, which was 1944, £14.95 net profit was made for every £100 sold. This suggests that despite increasing sales the business was not quite as successful as before.
If you have any thoughts, ideas, or questions you would like to ask please drop us a line via email on newmanbrothers@coffinworks.org .
If you missed out on the first instalment in our “Tales from the ledgers” series, please click the link below to look into the net profit of the business. Do keep an eye out for later instalments in the following weeks.
https://www.coffinworks.org/tales-from-the-ledgers-profit/
By Lindsay Whitlow, Volunteer